Summary Reports plugin for AppGini
Summary Reports plugin for AppGini
Summary Reports plugin enables you to build powerful reports and charts inside your AppGini application through a few simple steps. See the big picture and discover trends in your data that empower you to take the right decisions confidently.
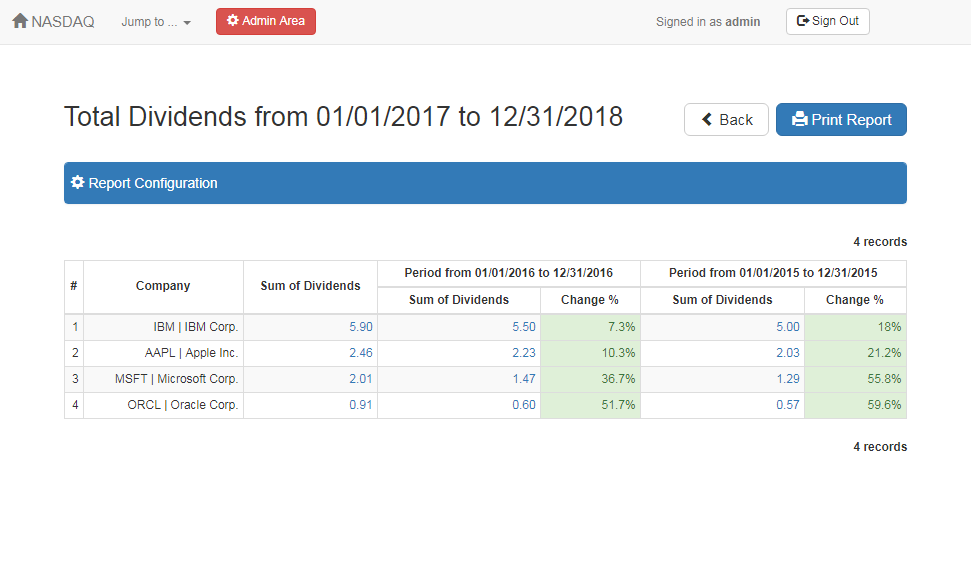 Intuitive reports that tell an intriguing story. Summary Reports plugin creates beautiful, easy-to-understand reports that don't just summarize data. With a glance at the report, you can see the big picture behind the tons of daily details. And you can see the trends and changes in your data over time. Make decisions with confidence in the shortest time.
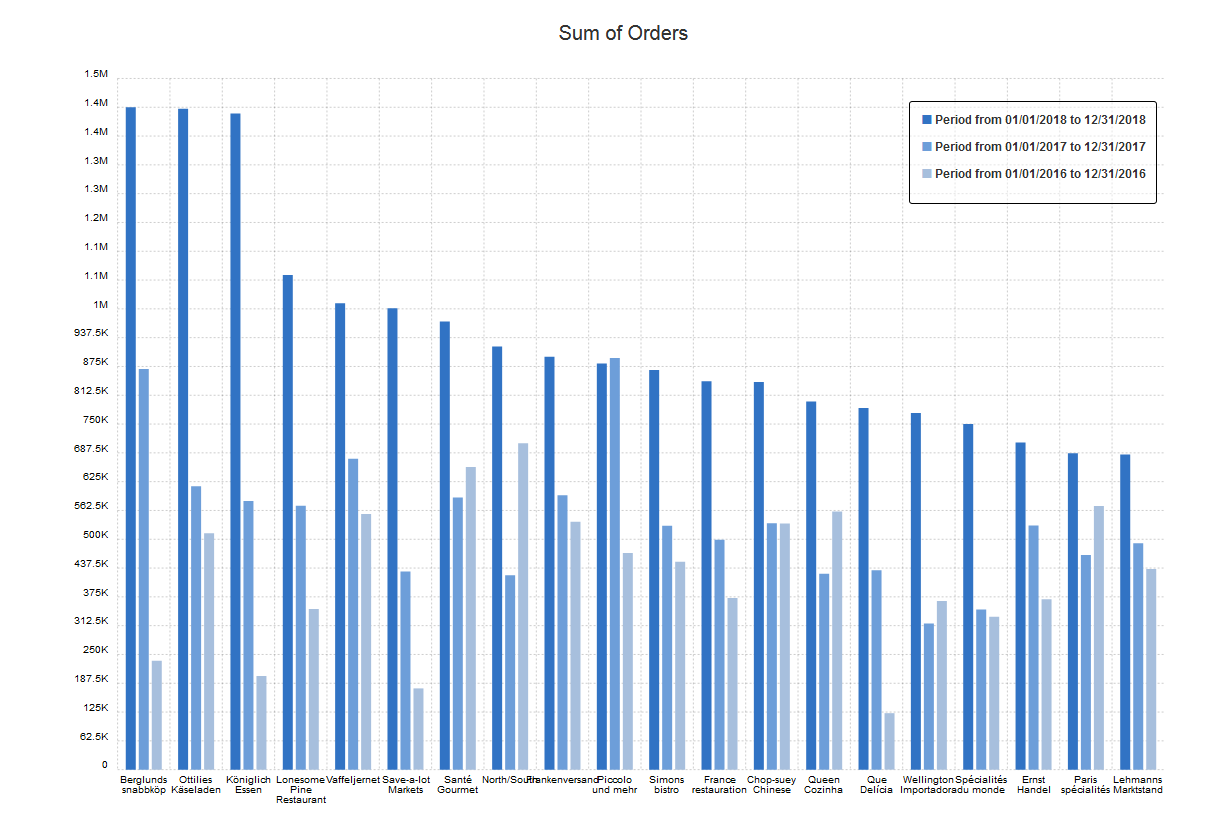 Visualize your data and instantly see patterns and trends. With the Summary Reports plugin, you can create beautiful bar and pie charts that allow you to visually compare summarized data across not only categories, but also date periods. You can instantly spot trends and patterns in a natural way and communicate your ideas flawlessly. Charts are themeable and very easy to configure.
 Export report data to CSV. Users can export report data to CSV and open in Excel or other spreadsheet software and perform advanced analysis and processing. So, even if Summary Reports is missing some feature you'd like to have, you can easily continue your workflow in Excel.
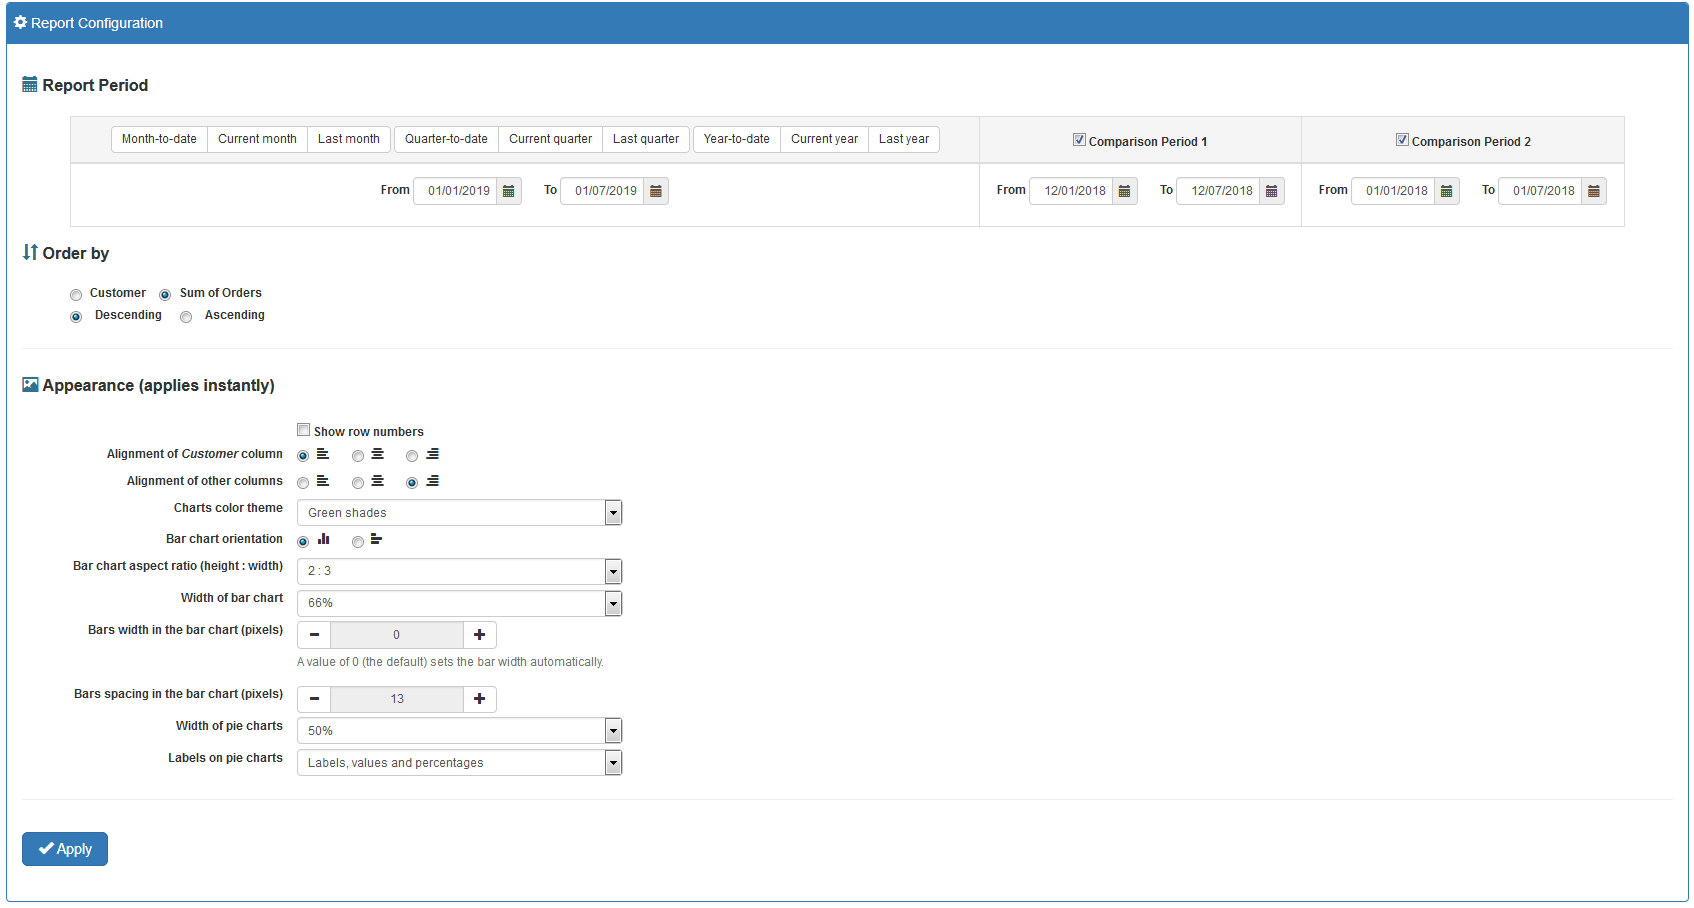 Explore data insights interactively. Generated summary reports come with a report configuration dialog that empowers users to interactively set the report date range, comparison period, sorting, and other options. This makes exploring data and discovering trends a piece of cake.
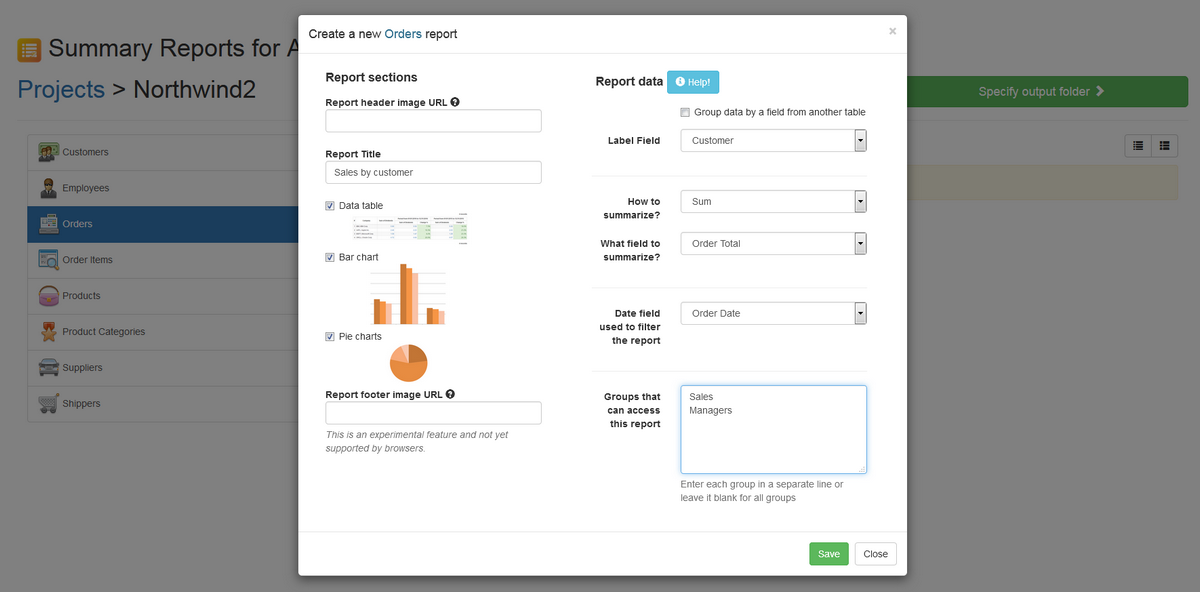 A friendly interface that makes creating reports a breeze! You don't need to learn or experiment with complex SQL or programming code to create summary reports. The Summary Reports plugin has a very intuitive interface that makes it trivially easy to create any number of reports in no time. And you can control who has access to each report. Create, edit and delete reports on the fly from any where. Feel free to explore!
Features in brief
- Five ways to summarize your data: Count, sum, average, maximum and minimum.
- Easily create great-looking bar and pie charts. Charts can be configured by users (colors themes, orientation, dimensions, .. etc).
- Users can export report data to CSV to open it in Excel for advanced analysis.
- Filter reports by up to 3 date ranges. Users can optionally limit reports to a specific date range. They can also define up to 3 date ranges per report to compare and discover trends in their data.
- Drill down to details. Summary reports show summarized data (totals, averages, counts, .. etc) and allow you to click on the figures to open a filtered table view to explore the details from which the summaries were calculated.
- Flexible customization of report data through SQL. You can optionally add custom WHERE conditions using standard SQL syntax to control which data is included/excluded from reports.
- Restrict report data on a per-user basis. By default, summary reports are limited to user-accessible records rather than all records (with an option to disable this if desired).
- Control who can access each report. For each report, you can allow access to all user groups, or specify which groups have access.
- Create reports from any web browser. You don't need access to your PC to create and edit reports. Just sign in as admin from any browser on any device and control your summary reports.
- Reports configuration is saved in your AXP project file. Thus, you can safely work with your project in AppGini and re-open it in the plugin without losing any of your reports.
- One time installation. You don't need to install Summary Reports plugin into each AppGini app you have. You can install it into one single app and create reports for all other apps you have on the same server.
Tutorial: Using Summary Reports
If you are using AppGini 23.17 or above, please disregard the installation instructions in the video and use the steps in the first FAQ item below. The rest of the video is still useful for understanding how the Summary Reports plugin works.
Frequently asked questions
How do I install this plugin?
Follow these steps (or watch the video at the right):
- Sign in to your AppGini application as admin and go to the Admin area.
- Open the Plugins menu and select Install a plugin.
- Enter your plugin order info and click View available plugins. This would list all available plugins you have ordered.
- Select the plugin(s) you'd like to install to your app and click Install selected plugins. The plugin(s) would be installed automatically.
Which version of AppGini is required for running Summary Reports plugin?
The latest version of AppGini is generally recommended when running AppGini plugins, but AppGini 5.98 or above is required.
If a new version of AppGini is released, do I need to update Summary Reports plugin as well?
Usually not. However, if an update is needed we'll issue it free-of-charge.
I already have another plugin installed. Is it safe to install this plugin to the same app into the same plugins folder?
Yes. AppGini plugins share a common set of files that ship with all plugins and are safe to overwrite. Plugin-specific files are installed into a separate subfolder under the plugins folder. So, it's safe to extract this plugin to the plugins folder, overwriting existing files. Both plugins will continue to work fine.
If you make a new version of Summary Reports, do I have to pay to upgrade?
No. If you buy Summary Reports plugin, you get free life-time updates to it.
I have several AppGini applications. Do I have to buy a separate license of Summary Reports plugin for each?
No. When you buy Summary Reports plugin, you can install it to all of your AppGini applications. However, just like AppGini, if you are a team of users who use AppGini as part of your development toolset, each user should have a separate license.
I noticed that Summary Reports plugin can automatically configure the hooks. If I have custom hooks in a project, will Summary Reports plugin overwrite them?
No, it will just insert its code into the links-home.php and links-navmenu.php files without replacing any existing code.
I created some summary reports for an app but now I want to remove them all. How do I "uninstall" summary reports from my app?
If you want to delete all summary reports from an app, open the hooks folder of that app and delete
SummaryReports.php and all the files starting with summary-reports. Next, open the files links-home.php and links-navmenu.php and delete the summary reports entry from both.Charts in my report don't display all the records that appear in the report table. How can I fix that?
By default, charts display only the first 20 records to make it easier to read, without cluttering the chart with lots of points. You can change this by editing the report file (which you can find in the hooks folder .. the file name is displayed in your browser address bar when you view the report). Find this line in the file and change the value as desired:
'chart_data_points' => 20,
How can I translate the interface of the reports from English to another language?
Summary reports use text defined in the file
hooks/language-summary-reports.php. You can edit the strings in this file to translate the reports to your language. But first, please check the language download page to see if a translation is already available for your language.I have a question not addressed here ... how can I contact you?
Please use our online support form.
What's new?
Latest version: 3.6, released on Jun 5, 2025
- Summary Reports 3.6, Jun 5, 2025
- Fix theme loading with apps created by AppGini 25.11 and above.
- Allow admin group members to access plugin if multiple admins option is enabled.
- Improve file name validation for uploaded files to allow dots in addition to existing characters.
- Don't disable continue button if path check shows as invalid since it might not be accurate on some servers.
- Summary Reports 3.5, Dec 13, 2023
- Fix PHP 8.x warnings.
- Summary Reports 3.4, May 4, 2022
- Compatibility with AppGini 22.13.
- Drop support for IE 8, 9.
- Fix error when creating
plugins/projectsfolder in some scenarios.
- Summary Reports 3.3, Oct 31, 2021
- Fix bug identifying report date field in reports list
- Clear warning message for reports with no parent table.
- Fix bug in parsing report dates in PHP 7.3+
- Fix CSV file naming issue and CSV file encoding
- Fix caption of summary column
- Fix bug with loading saved reports in some cases.
- Security fixes: sanitize date parameters against reflected XSS, and fix a stored xss issue.
- Fix compatibility issues with PHP 8, 8.1
- Summary Reports 3.2, Jan 19, 2021
- Compatibility with apps created by AppGini 5.93.
- Summary Reports 3.1, Dec 2, 2020
- Fix bugs with non-Latin data encoding.
- Load the latest existing jquery lib.
- Add plugin version checker/notifier.
- Show a default table icon if set one not found in project viewer.
- Fix buggy UI behavior when pressing Home/End multiple times in project viewer.
- Summary Reports 3.0, Apr 18, 2020
- Screenshot summarizing major changes
- By default, summary reports are limited to user-accessible records rather than all records.
- New report editor option to show all records in reports, overriding user permissions.
- New report editor option to add custom WHERE conditions using standard SQL syntax to control which data is included/excluded from reports.
- New fields dialog in report editor to list possible fields for use in the custom WHERE clause of reports.
- UI enhancements
- Add Compact mode to report editor form, and persist this setting.
- Preserve reports list detail level when re-opening project page.
- Show reports count in the tables list.
- Hide Clear reports button if there are no reports to clear.
- Add help hint to all report editor action buttons.
- Various other improvements in report editor.
- Add icons to report titles in reports list indicating reports with custom WHERE and those with override permissions.
- Collapsing report config panel in generated reports applies changes, without having to scroll down and click 'Apply'.
- Bug fixes
- Bug fix when opening a project containing tables with a single field.
- Add a logging function in reports that is triggered by passing
_debug=1to the report URL (only works on localhost and for super admin user). - Strip HTML tags from labels when plotting charts (since charts don't support HTML rendering anyway and fall back to showing raw HTML labels).
- Fix bug leading to overwriting some reports on editing other ones.
- Include 'from to' part of the report title in translation file.
- Summary Reports 2.1, Mar 28, 2020
- Option to clear old existing reports in a project.
- Improved plugin UI.
- Various bug fixes.
- Summary Reports 2.0, January 14, 2019
- Added customizable bar and pie charts to reports.
- Added ability to export report data to CSV file.
- Added option to include a report header and footer.
- Optimizing reports performance when summarizing huge data sets.
- Easily toggle highlighting of rows in the report by clicking on them.
- Added inline help to report editor.
- Added a language file to easily translate reports.
- Many improvements and bug fixes.
- Summary Reports 1.01, May 16, 2018
- Bug fix for date range where condition + code refactoring
- Summary Reports 1.00, May 15, 2018
- First release!